 Better 311Filed
← All briefs
Better 311Filed
← All briefs
Public graffiti reports rose 69 percent in a week and private reports rose 77. Mission carries a third of the load, and the record is full of repeats.
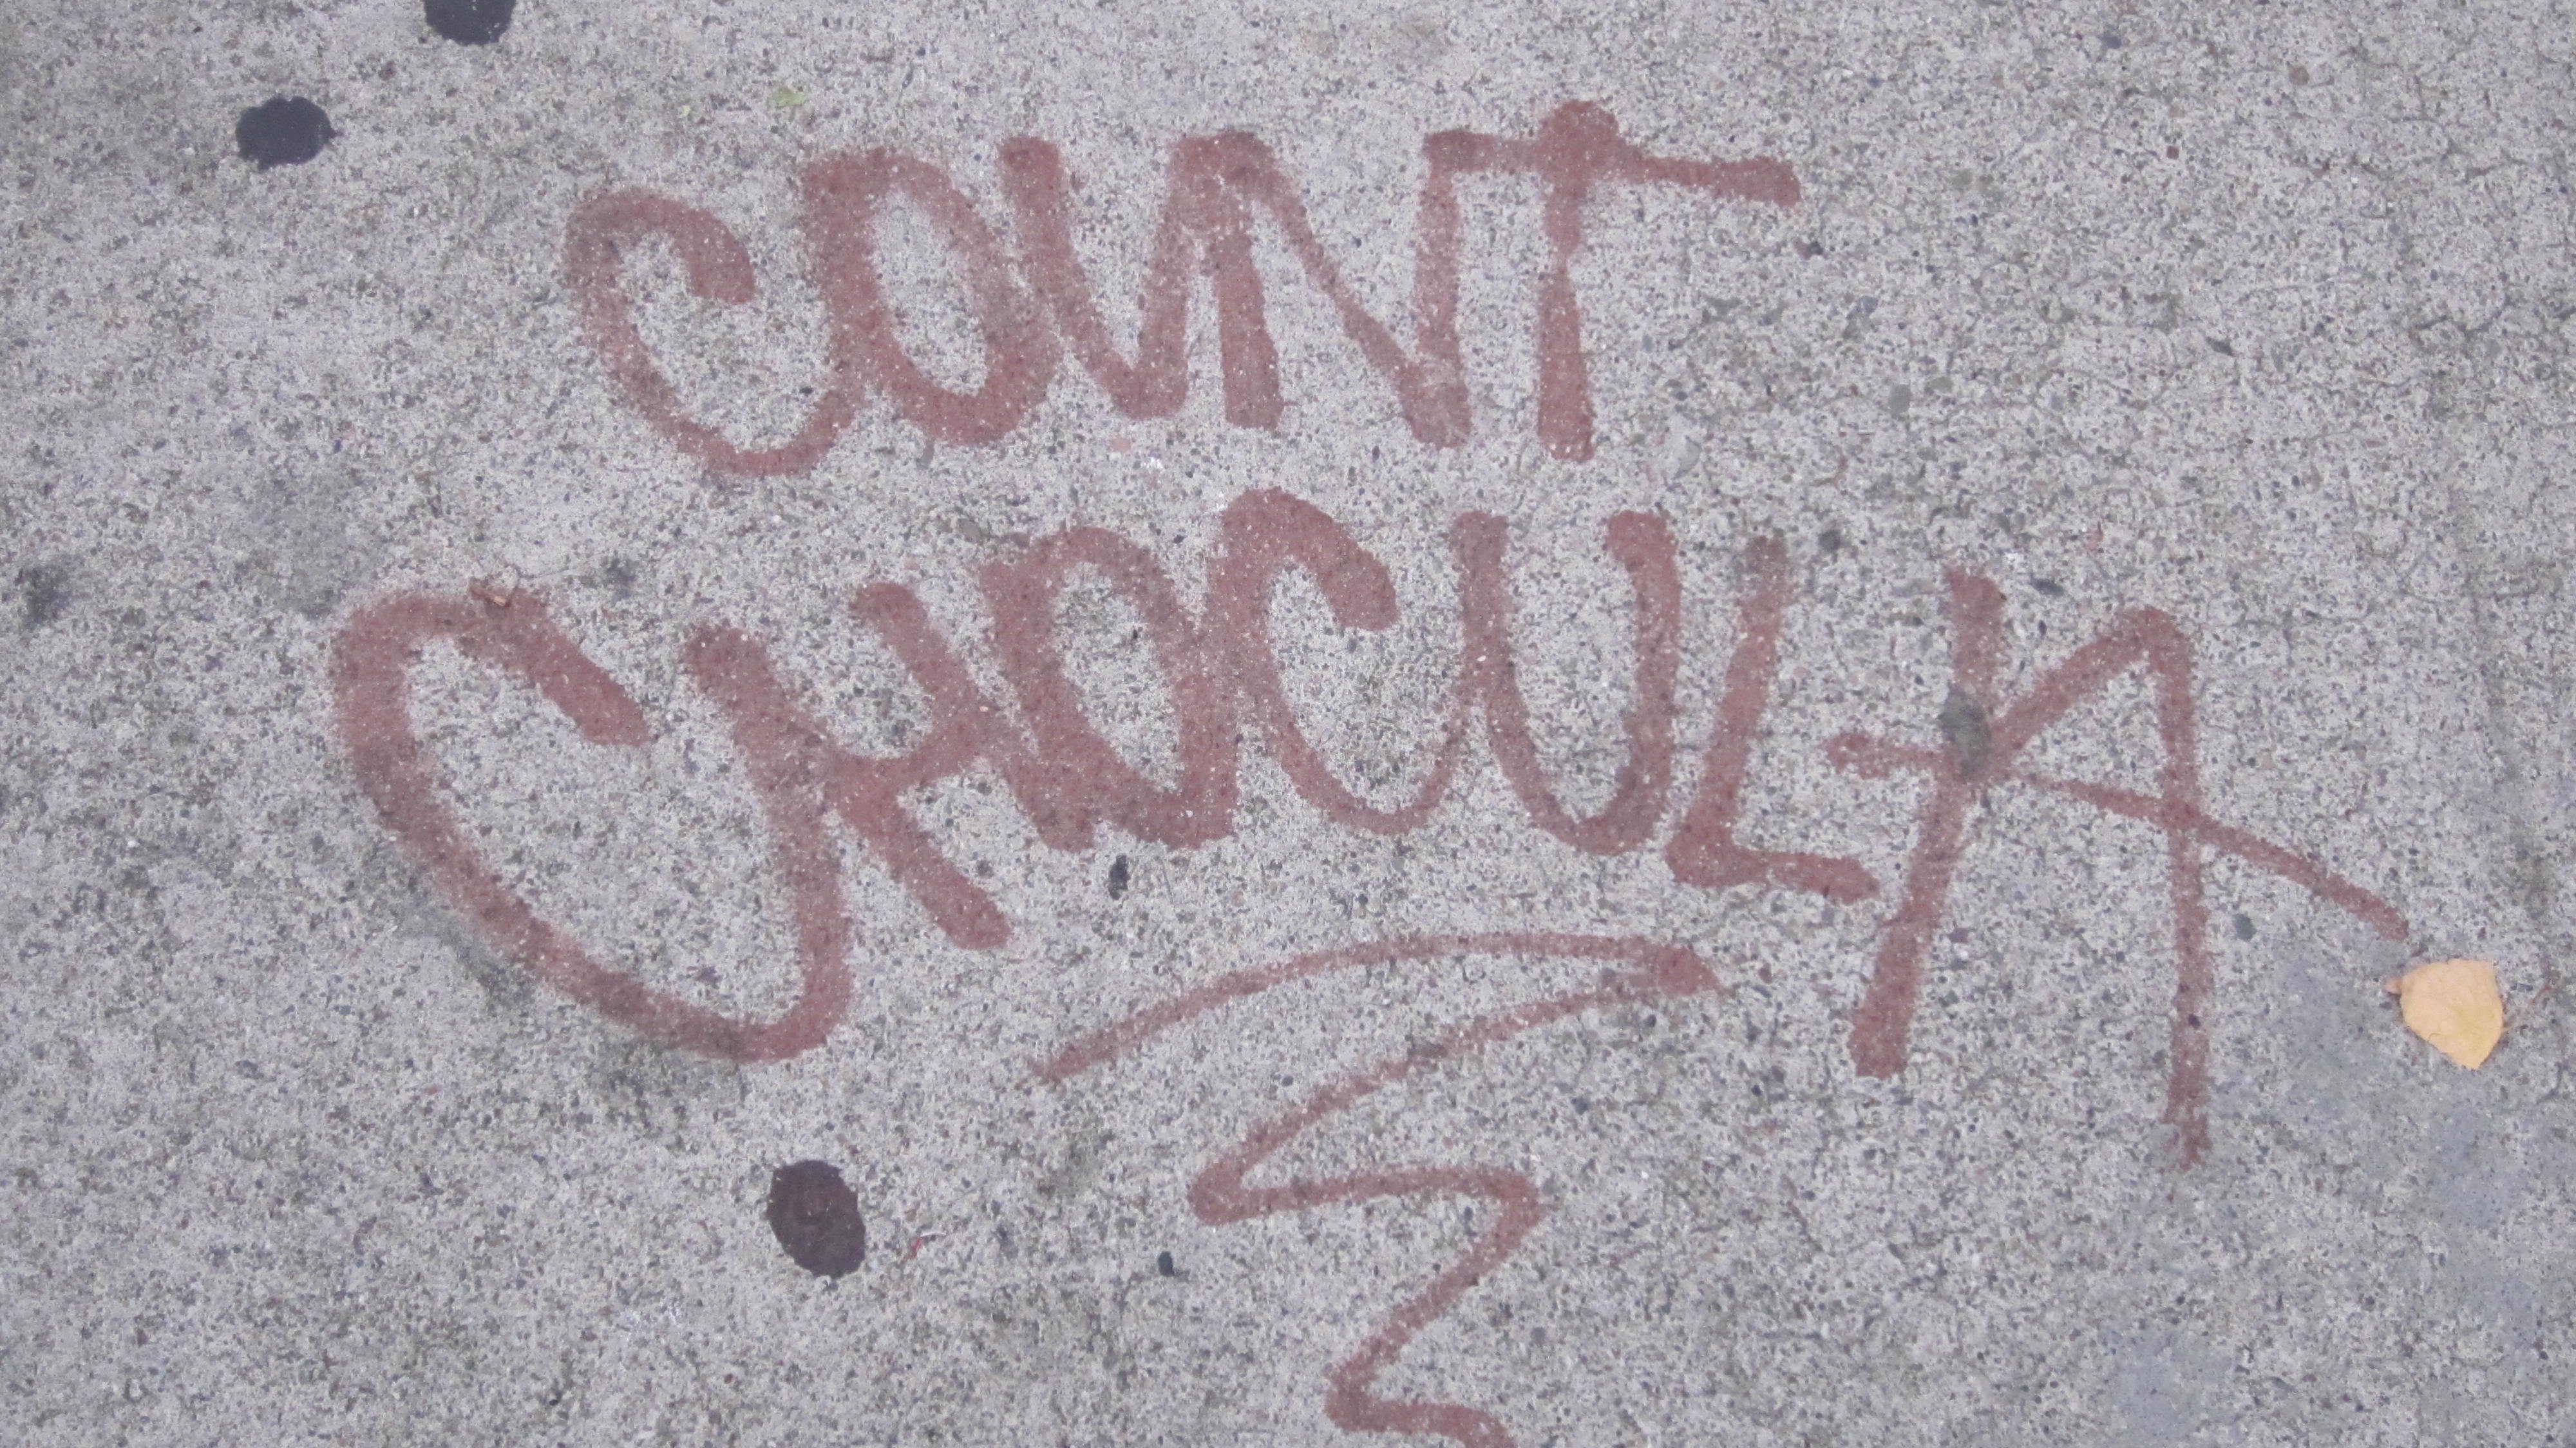
The wall at 98 Carl Street was painted on August 7. The city's own note says so: "painted SES Graffiti Crew." Six new reports about that same wall landed between August 27 and August 30. All six are still open.
That is the shape of this week's graffiti number. Public-property reports hit 1,147 in seven days, up 69 percent from the prior three weeks. Private-property reports hit 566, up 77 percent. The jump is real, and it is also smaller than it looks: the same week last year produced 2,572 public reports, more than double this week's count.
The count is not a count of walls. Seventeen Hoff Street in the Mission drew seven graffiti reports in one week, and five of them were merged into a single earlier case. The file keeps every entry, and the totals count every one. About one in seven reports in this window closed as a duplicate.
The geography is uneven, and the Mission is where it lands. Eighteenth Street alone drew 71 reports in the week, split almost evenly between public and private property. Valencia drew 34, Capp 21 on the private side. That private split matters: on private property, the city notifies the owner, and the owner is responsible for removal. The same wall can therefore cycle through both sides of the system, reported, painted, tagged again, reported again.
Two-thirds of this week's public reports were still open when the data was checked. Part of that is age: most of these cases are only days old. Part of it is the pattern this record keeps showing. The Carl Street case was closed as painted on August 7 and generated six new reports by August 30. A closed entry and a cleaned wall are different facts.
The year-over-year context is the part the spike headline leaves out. August 2025 peaked at 10,305 public reports in a month. August 2026 is at 4,872. Last year's same-week comparison was flat, so the calendar alone does not explain this jump. The record cannot say why more reports landed this week: more tags, more people filing, or both. It can say the level is still roughly half of last year's.
Keep the case number when you file. If the case closes as a duplicate, the parent case number is in the note, and that is the one to chase. Report again with the old number, the date, and a photo. The walls keep coming back; the paper trail is the part that stays yours. Otra vez, con el número.
Five numbers, one chart, and one local story each week.